Case Study 1
Visual data analysis in Excel spreadsheet using Power Pivot, Power Query and Power View add-in
Excel is one of the most universal and widespread analytical programs in the world. It has many different applications and one of them is BI analysis. However, to be a fully functional BI tool it must be extended by three add-ons:
- Power Query – a tool that allows to create a connection with data from various sources; thanks to PQ it is possible to convert data to the desired form, which in turn can be used for further analysis;
- Power Pivot – an add-on that provides the possibility of linking data in order to create a relational data model and perform intermediate aggregations and calculations that form the basis for further analysis;
- Power View – visualization module; a tool used to create reports and visual analysis of data.
Power Query
Power Query (PQ) is an Excel extension that allows, above all, to convert data into a form that will enable their further use. The need to use PQ often arises at the time when it is not possible to work effectively on the source data because of their dispersion, form or format (e.g. after their direct export from the ERP system). In such a case, PQ is an ideal solution, which will easily allow changes to these data, as well as their verification and expansion.
The basic activities that can be carried out with PQ include:
- creation of connections to different data sources,
- collecting data from different sources and in different formats,
- data conversion – changing the form of data by means of numerous data processing tools, as well as combining or separating them,
- creation of a query schema – i.e. an algorithm of data conversion, which will enable its automatic change, e.g. after the expansion of source data, making data available – e.g. as an Excel sheet.
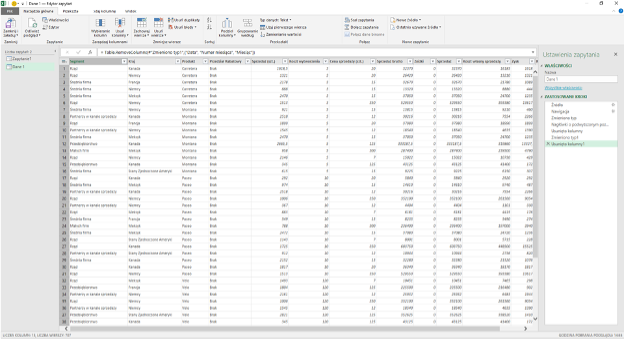
Query editor in PQ
Power Pivot
Excel’s Power Pivot (PP) extension is used to create complex data models that can come from a variety of sources. Due to its ability to adopt, create and manage relations, it is a great tool to support multidimensional data analysis. With PP, a variety of tasks can be successfully carried out, such as:
- collect data from multiple sources (and in different file formats),
- combine data into relational data models,
- manage relations,
- handling large data sets without any problems,
- use DAX language commands that give you new possibilities,
- generate any computational fields and columns,
- build hierarchies,
- create KPIs (key performance indicators),
- create result reports in form of e.g. pivot tables.
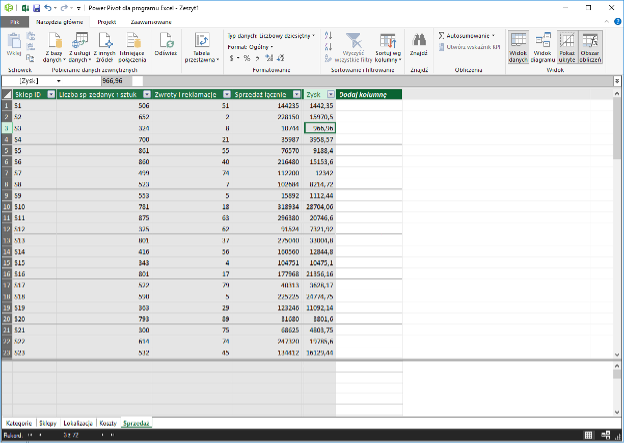
PP window
Power View
Power View is the final stage of data analysis and enables final conclusions based on graphical distributions. Due to the fact that the phenomena occurring in the modern world are complicated and complex as well as described by very large sets of information, a reasonable necessity arose to expand the possibilities of their presentation in addition to the pivot table and pivot chart, which were already available at the stage of conversions (PQ) and at the stage of creating a relational data model (PP). Power View offers many visualization tools, which are listed below.
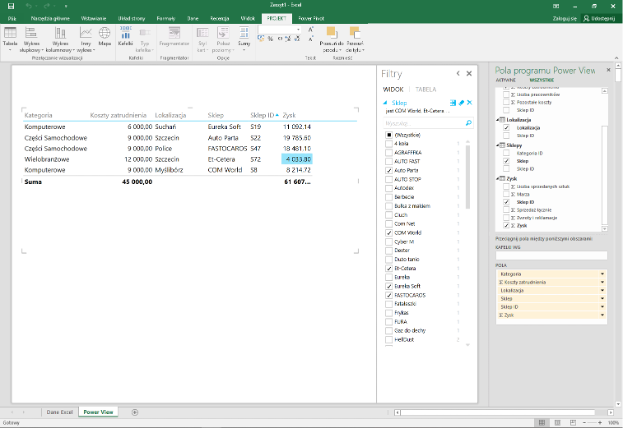
Power View window
Examples of data visualization in PV
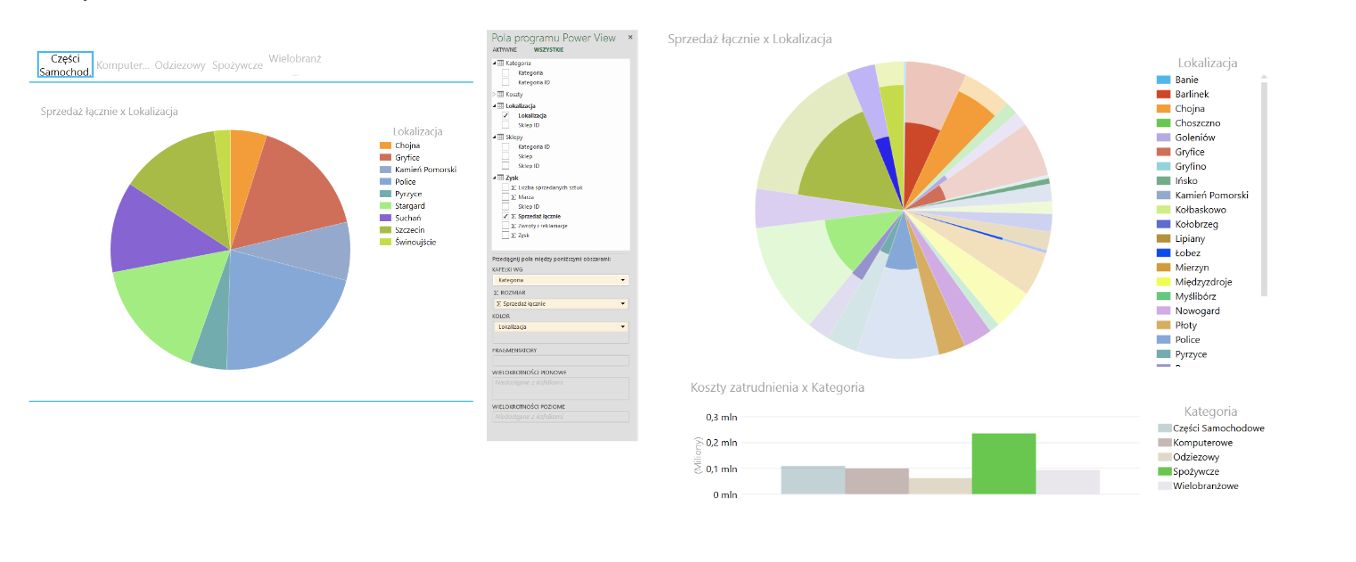
Example PV visualizations
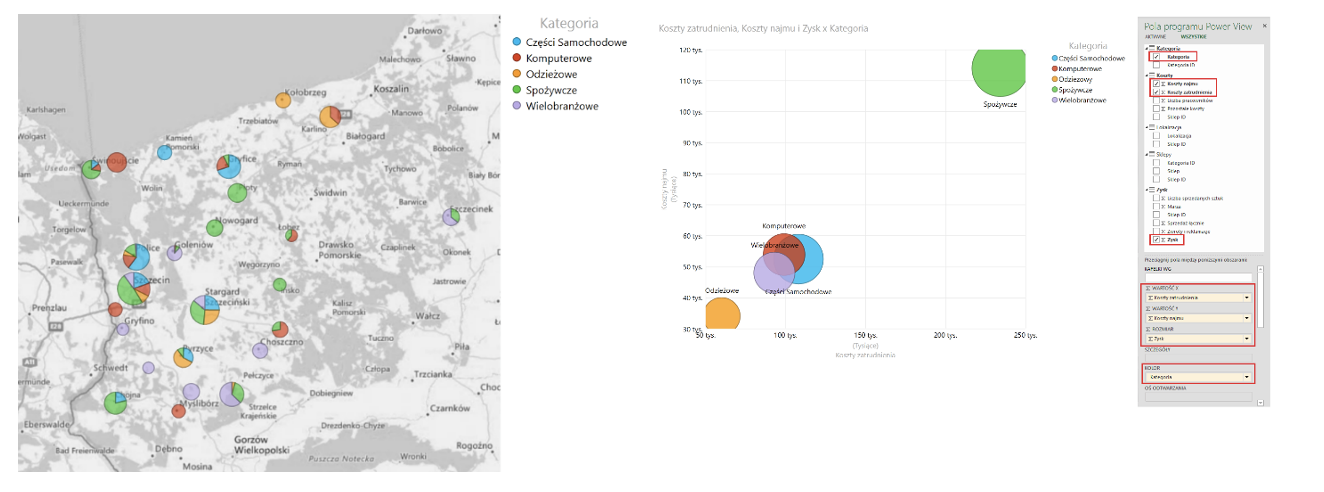
Example PV visualizations

