Case Study 2
Visual data analysis in Power BI
Power BI is a dedicated tool for multidimensional data analysis. It is available in three basic versions:
- desktop version for installation on computers,
- dedicated version for mobile devices,
- online service, which can be accessed via an Internet connection and a web browser.

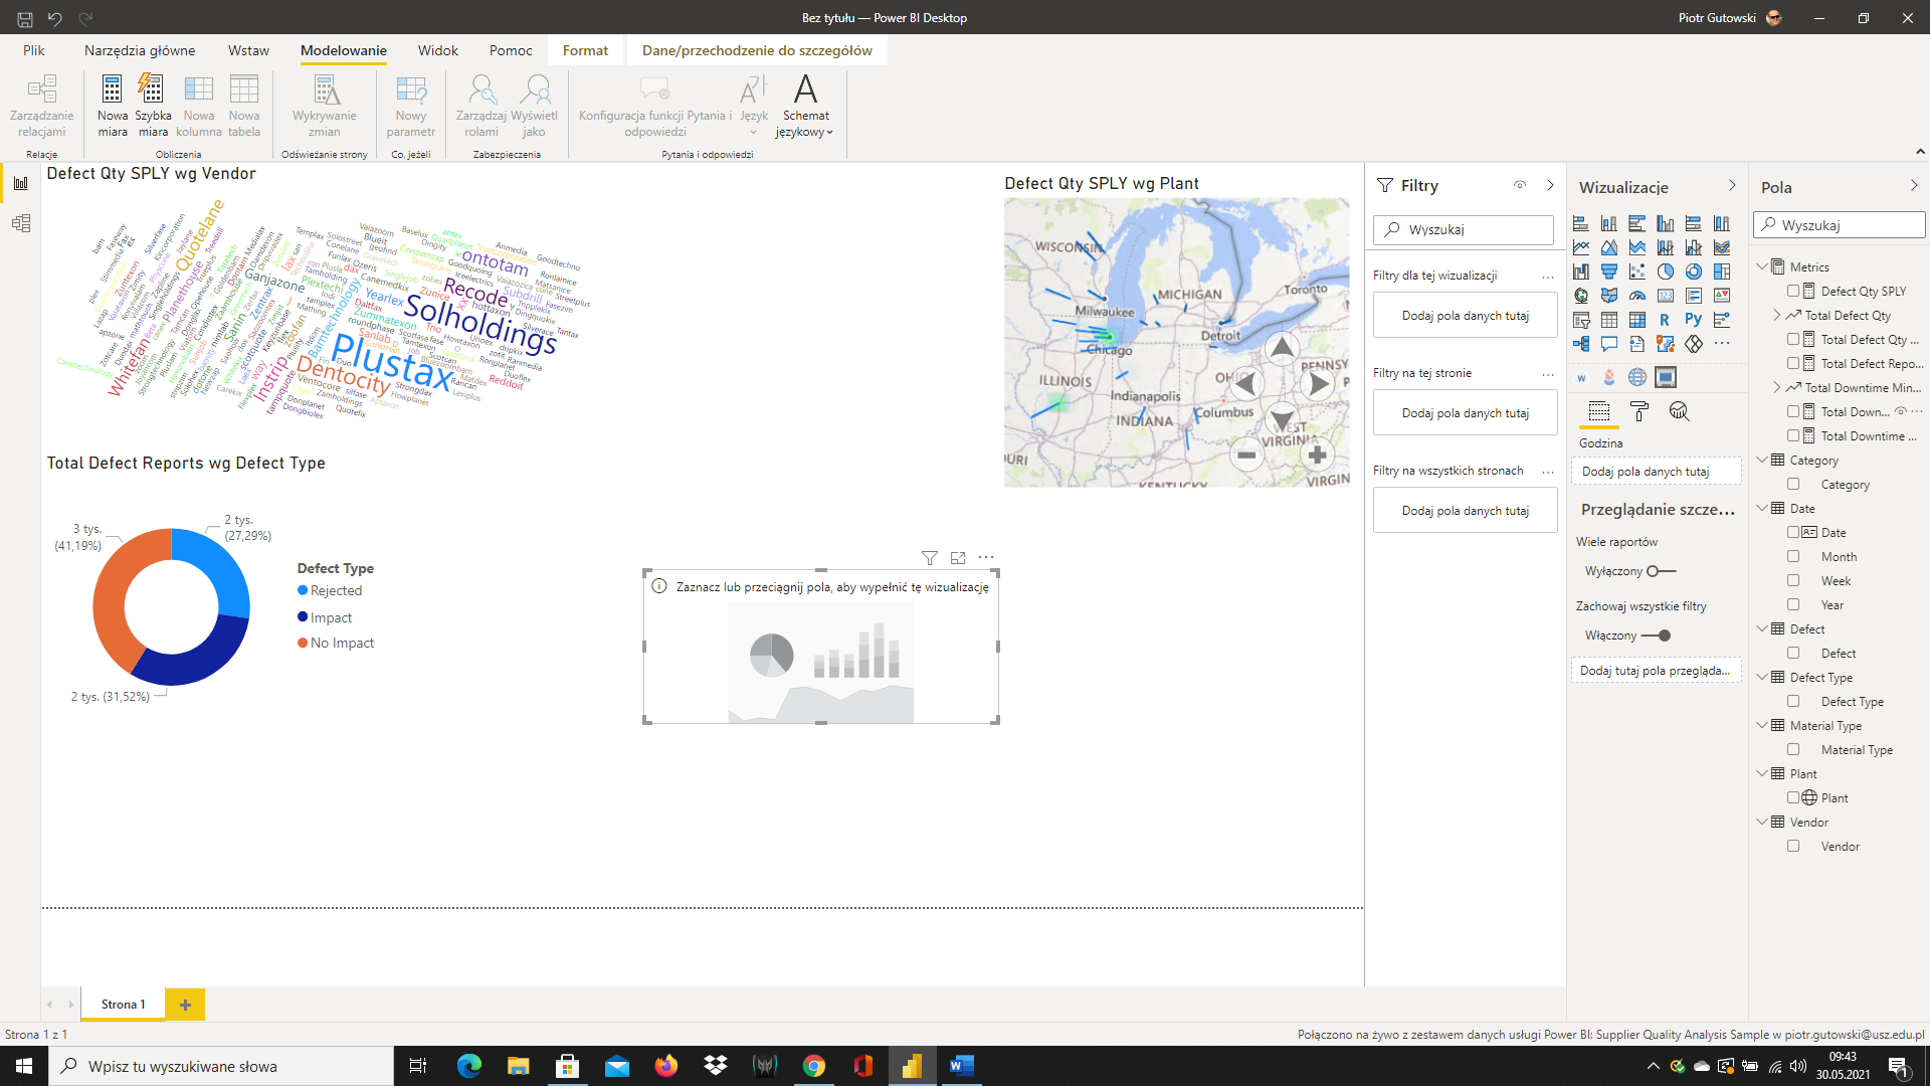
Working in the main program window
The program has a complete set of functionality that provides the possibility to connect with data from different sources, associate them with one another thanks to relations, perform additional analytical operations and finally visualize them in a desired way.

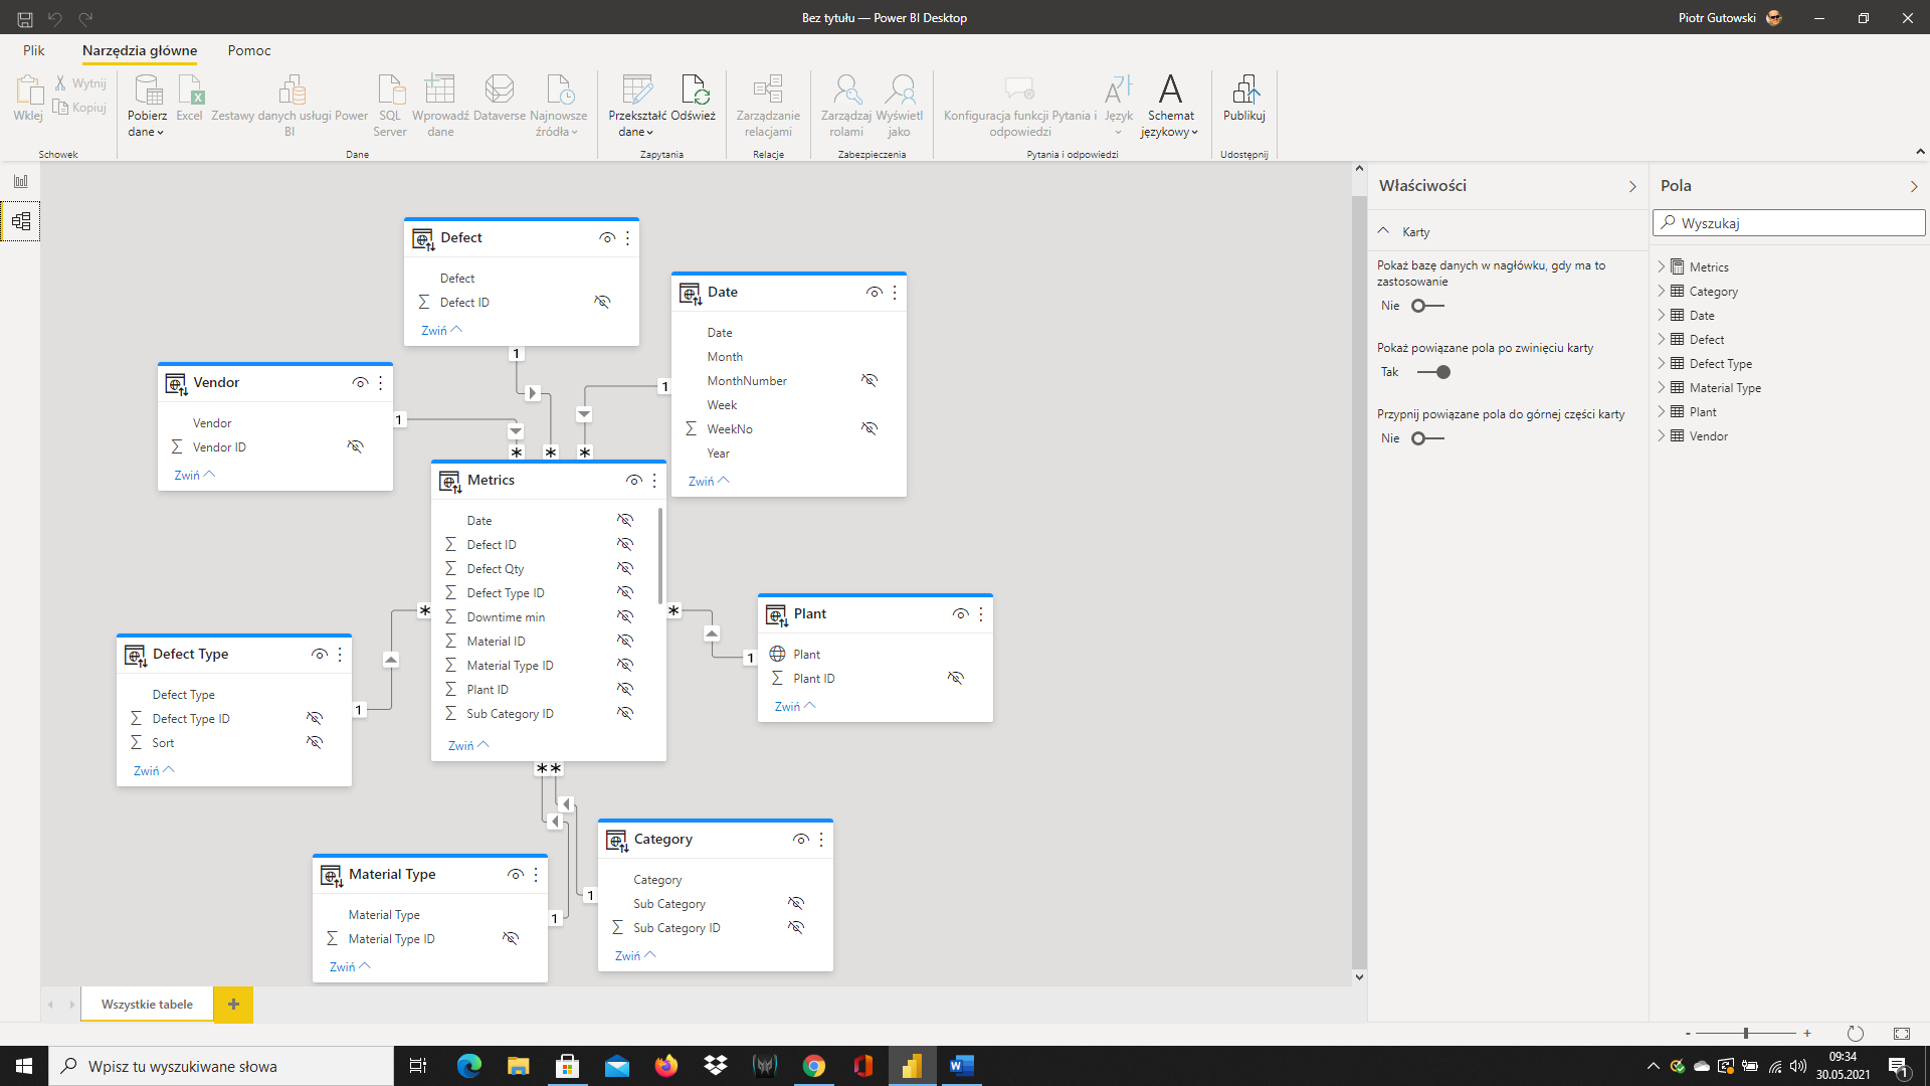
Relation diagram in Power BI
The basic functions of this program include:
- secure connection to hundreds of data sources – in the cloud and local,
- data conversion and creation of data mashups from multiple sources with just a few clicks,
- extend your own data models with DAX formulas,
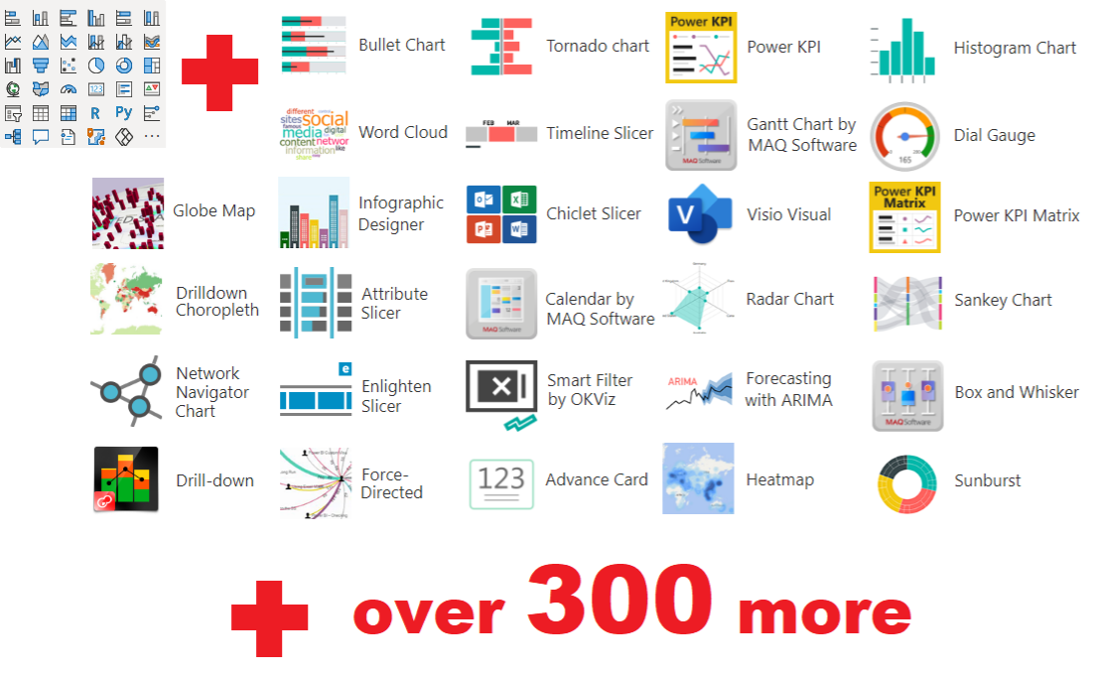
- choose from over many modern data visualizations or create your own visualizations,
- explore data to find patterns and obtain detailed information,
- create your own design with intuitive formatting tools and themes,
- create reports for mobile devices designed for users on the go,
- share visual analytics with everyone in your organization,
- secure publication to the web or a local report server, or embed visualizations in your own website or application.

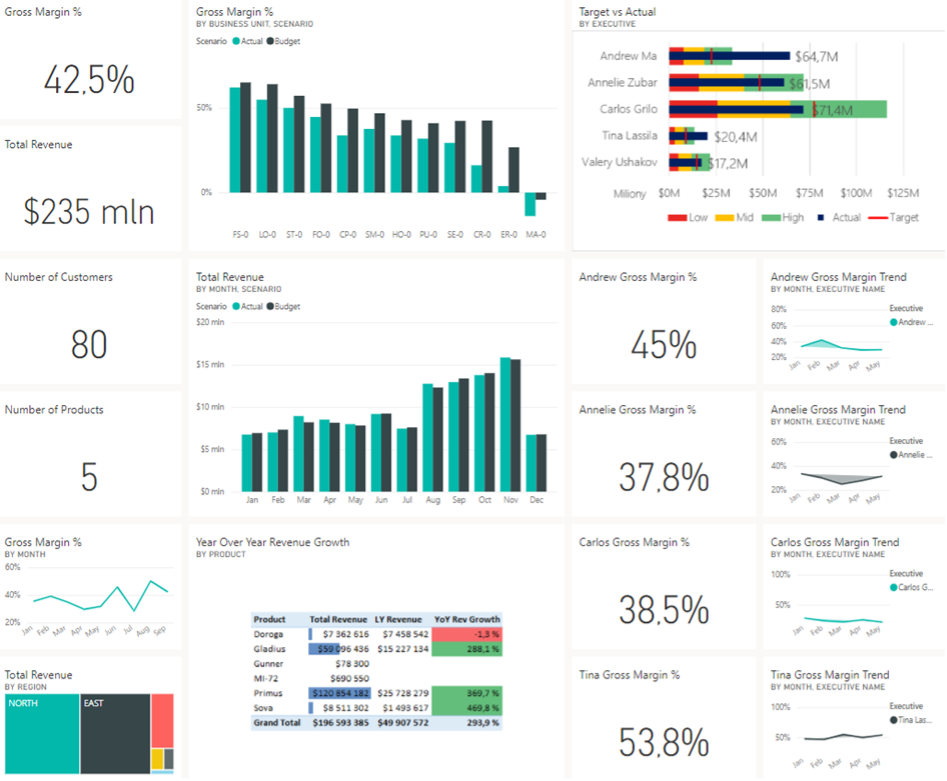
Sample report created in Power BI
The developer of this program is Microsoft, which has taken care to create a very extensive support for Power BI, providing numerous aids, instructions, videos, tutorials, examples, demo databases or test reports. More information and materials can be found at: https://powerbi.microsoft.com

Examples of visualization tools in Power BI
[1] D.M. Butler, J.C. Almond, R.D. Bergeron, K.W. Brodlie, R.B. Haber “Visualization Reference Models,” Proc. Of the 4th Conf on Vis ‚93, 1993
[2] B. Borucki, Visual Data Analysis and Visual Modeling: Challenges and Paradigms of the Future, lecture, https://www.ci.pw.edu.pl/content/download/1616/13173/file/Borucki_Bartosz_wyklad.pdf
[3] M. Banks, Visual Materials in Qualitative Research, PWN, Warsaw 2009, p. 198.
[4] B. Czapiewski, Visual Analysis, https://skuteczneraporty.pl/blog/analiza-wizualna-czyli-czego-szukac-na-wykresach/
