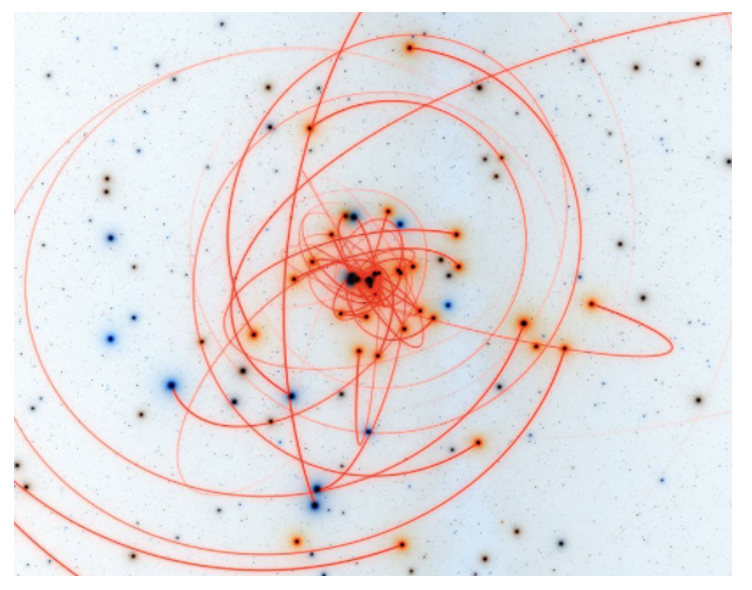
In the scientific space, various forms of images and graphics have very many applications and in most cases it is not a passive transfer of information. They are used as an important research tool and the spectrum of methods and areas of their application is very wide. Despite their interdisciplinary, multicriteria and convergent nature, a general list of analytical visualizations can be adopted, dividing them into:
-
Module 1 – What is Visual Literacy for Engineers? 9
-
Video Overview of Module 1Module1.1
-
ACTIVITY: Download Module 1’s Learning ObjectivesModule1.2
-
Why Visual Literacy is importantModule1.3
-
Case Study on Importance of Visual LiteracyModule1.4
-
The role of Visual Literacy in EngineeringModule1.5
-
Visual Literacy and CreativityModule1.6
-
Visual Literacy in EngineeringModule1.7
-
Digital technologies and Visual LiteracyModule1.8
-
Test your knowledgeQuiz1.15 questions
-
-
Module 2 – Digital Visual Tools for the effective use of images, graphics or objects for engineering tasks 5
-
Video Overview of Module 2Module2.1
-
ACTIVITY: Download Module 2’s Learning ObjectivesModule2.2
-
Using Visuals as Resources in an Engineering ContextModule2.3
-
Selecting the adequate tool for engineering tasksModule2.4
-
Test your knowledgeQuiz2.14 questions
-
-
Module 3 – Digital Visual Tools for Engineering Interpretation 7
-
Video Overview of Module 3Module3.1
-
ACTIVITY: Download Module 3’s Learning ObjectivesModule3.2
-
Interpreting Visually in an Engineering ContextModule3.3
-
Using Unity to “Interpret Forms”Module3.4
-
Using Autocad to “Interpret Graphics”Module3.5
-
Using Mathlab to “Interpret Data”Module3.6
-
Test your knowledgeQuiz3.15 questions
-
-
Module 4 – Digital Visual Tools for Engineering Analysis 12
-
Video Overview of Module 4Module4.1
-
ACTIVITY: Download Module 4’s Learning ObjectivesModule4.2
-
Visualization techniques’ role in analytical processesModule4.3
-
Basic visualization typesModule4.4
-
Main directions of visualization techniques application in scientific analysisModule4.5
-
Engineering disciplines that use various forms of visual analysisModule4.6
-
New possibilities of engineering analysis in a digital worldModule4.7
-
Data is everything, hence in a way everything can be visualizedModule4.8
-
Visual analysis of engineering data representation in visualizations of BI systemsModule4.9
-
Case Study 1Module4.10
-
Case Study 2Module4.11
-
Test your knowledgeQuiz4.15 questions
-
-
Module 5 – Digital Visual Tools for Solving Engineering problems 6
-
Video Overview of Module 5Module5.1
-
ACTIVITY: Download Module 5’s Learning ObjectivesModule5.2
-
Solving Visually in an Engineering ContextModule5.3
-
Using UML Diagramming Tool to “Visualise Solutions”Module5.4
-
Using Unity to “Explore”Module5.5
-
Test your knowledgeQuiz5.15 questions
-
-
Module 6 – Digital Visual Tools for Creating Engineering concepts and data 6
-
Video Overview of Module 6Module6.1
-
ACTIVITY: Download Module 6’s Learning ObjectivesModule6.2
-
Creating Visually in an Engineering ContextModule6.3
-
Using Coogle to “Envision”Module6.4
-
Using Autocad LT to “Create Forms”Module6.5
-
Test your knowledgeQuiz6.15 questions
-
-
Module 7 – Digital Visual Tools for Engineering Communication 6
-
Video Overview of Module 7Module7.1
-
ACTIVITY: Download Module 7’s Learning ObjectivesModule7.2
-
Communicating Visually in an Engineering ContextModule7.3
-
Using Thinklink to “SHARE”Module7.4
-
Using Draw IO to “DESCRIBE”Module7.5
-
Test your knowledgeQuiz7.15 questionsFinal
-
Main directions of visualization techniques application in scientific analysis
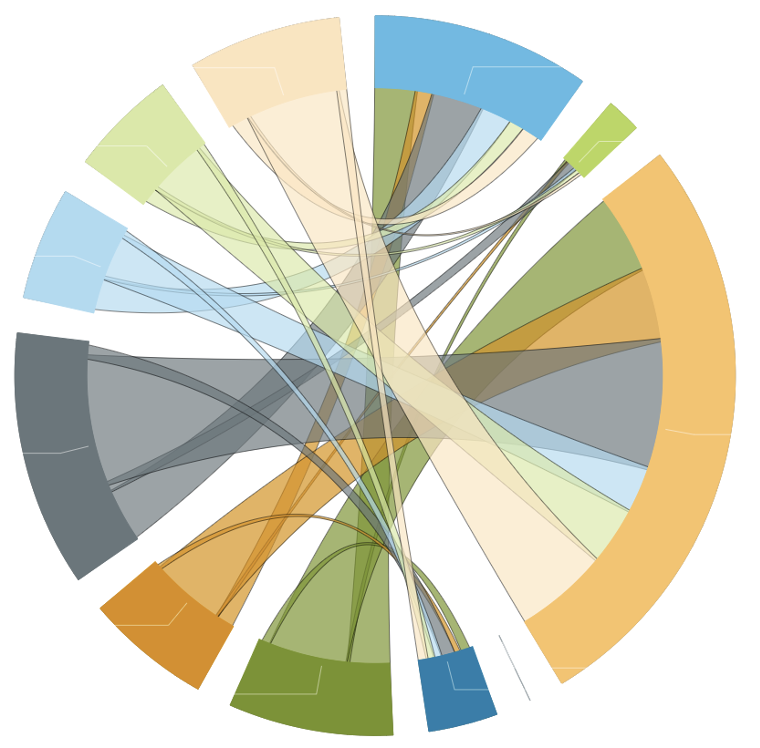
Data visualization – related to the association and appropriate compilation of mass data and their representation, e.g. in the form of graphics and charts as well as in other forms of reports; an area strongly supported by computers and stimulated by the development of ICT and information societies.
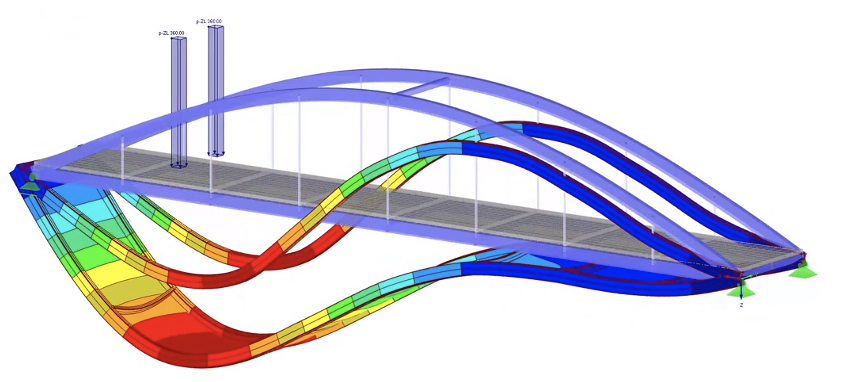
Visual simulations – reflecting a given environment and forces operating in it, which allows to verify various scenarios without the need to build real models (but not always); area strongly supported by computers; with advanced and specific analyses, it is necessary to create your own IT tool.
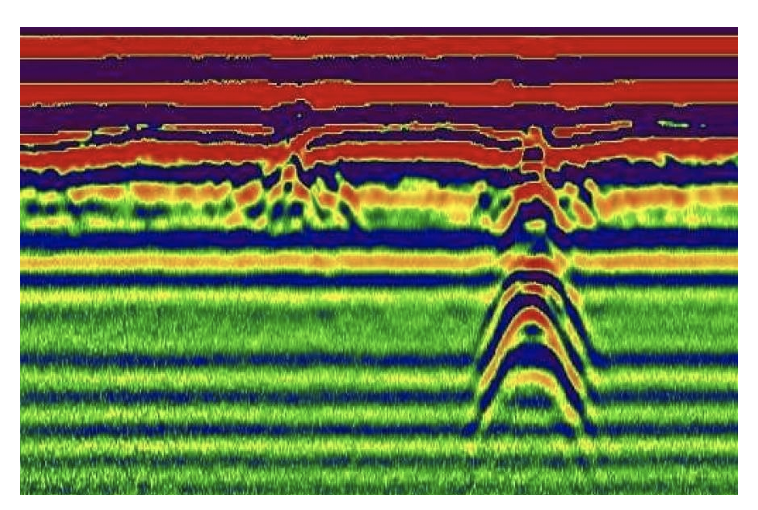
Visual analysis – making inferences directly using the images obtained; unpredictable research, often surprising with new insights.
Visual modeling – visual modeling either resulting from accepted mathematical algorithms or graphical modeling that allows a particular product or intermediate product to be given a desired shape.
