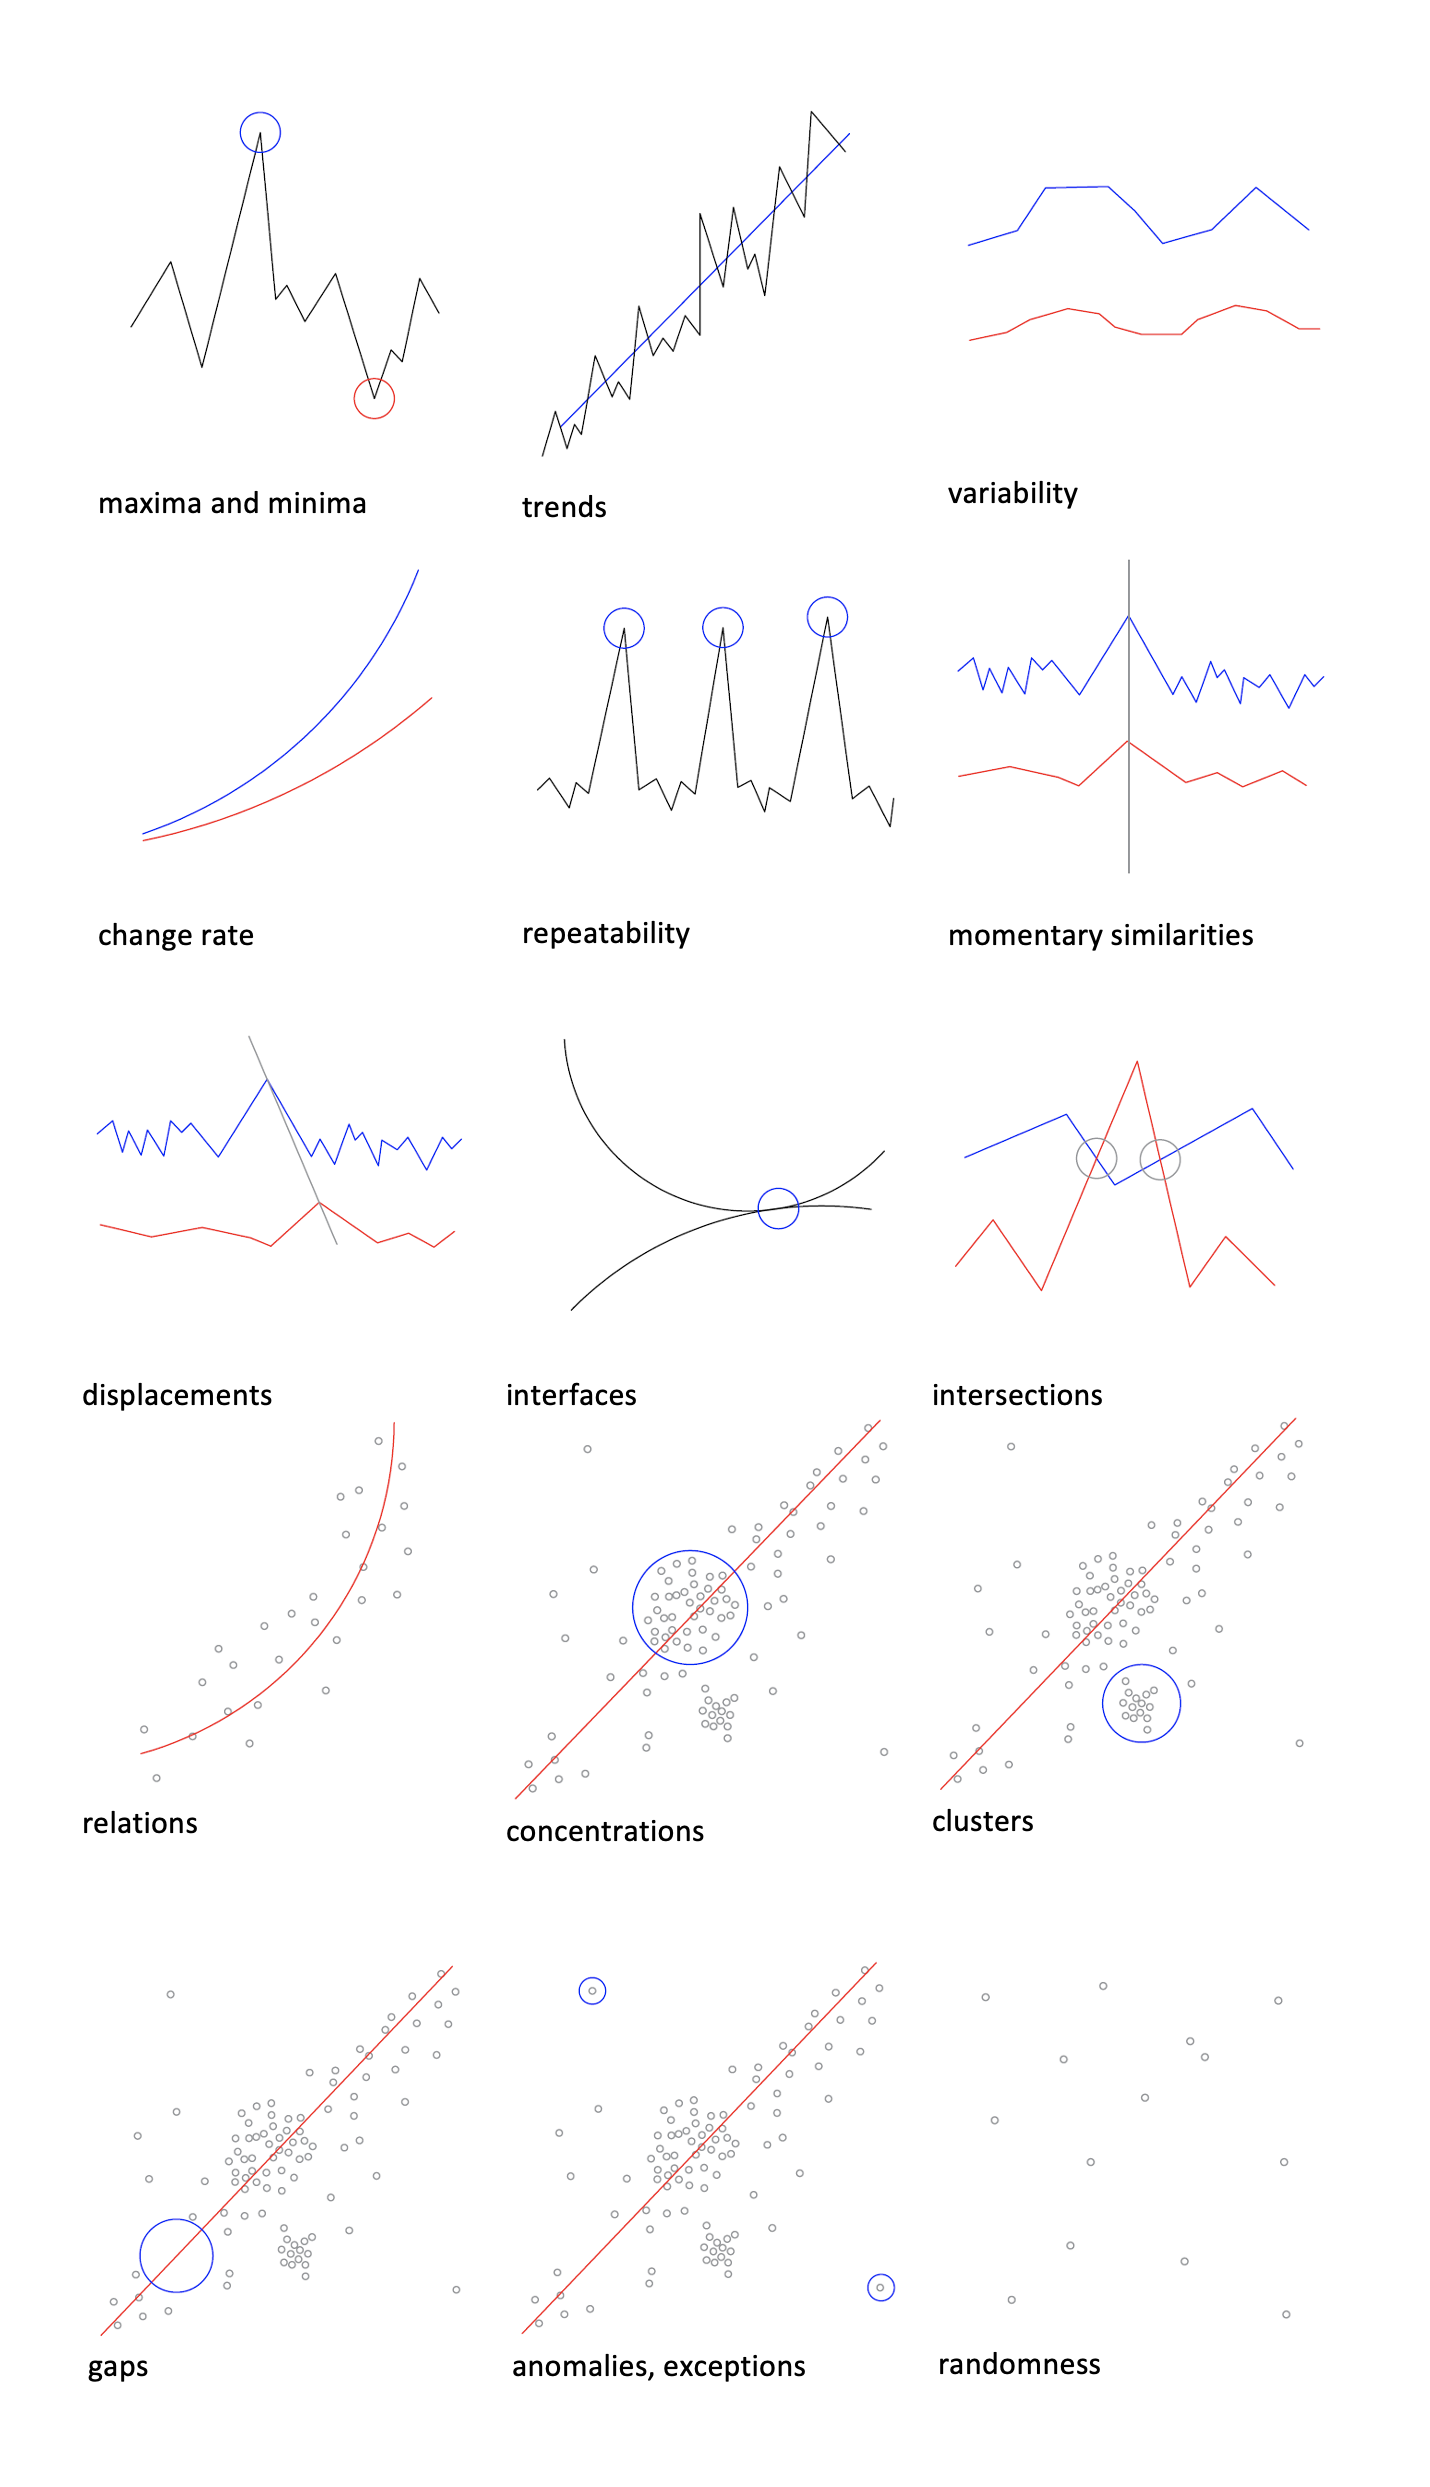
Visual analysis of engineering data representation in visualizations of BI systems
The BI systems offer a continuously growing, but still limited, base of visualization tools. This poses a limitation, as not all of them are suitable for effectively representing the essence of an engineering problem. However, if the possibility exists, such visualizations should be read using certain principles that, while they may not be a mystery to the researcher, may be a barrier to conveying knowledge to the reader. Moreover, images can be read in many ways depending on the social and individual context of the viewer [3]. The general principles of analyzing the visual representation of engineering data included in visualizations of BI systems are defined by the search for relations of any kind between the depicted information. Performing this process correctly leads to new knowledge and insights, while making a mistake at this stage nullifies the entire research process.
Visual cognitive process
The process of visual analysis can be divided into three basic stages, with the third stage being crucial:
- Information acceptance – its reception and recognition of assigned attributes such as location, shape, color, orientation, texture, etc.
- Information identification – grouping, organization, and formats of elements seen.
- Information analysis – searching for relations, patterns, synergies, similarities and correlations between information.
Examples of relations between data include:
- preliminary analysis – consisting of general observations and reading of background information,
- correlations and synergies – identification of relations between the studied phenomena,
- distributions – variations in the field of specific criteria,
- segmentation – searching for similarities,
- hierarchy – the order in which phenomena appear,
- deviations – differences with other models, anomalies. [4]
Some examples of preliminary, correlation and synergy analysis

